

High-throughput phenotyping (HTP) of peanut canopy height using digital surface models (DSM)
November 3, 2020
Virginia and Carolinas are the leading states for growing the large-seeded, Virginia-type peanut in the U.S.A. Growers use peanut as a “cash” crop because it provides better economic returns than other row crops. Cultivars with improved yield, disease resistance, and environmental suitability are developed after 10 years of extensive field selection across the three states. Plant morphological and physiological characteristics can assist breeding with time- and cost-effective, and accurate selection solutions. For example, peanut plant height plays important role in soil-borne disease infections, i.e. tall canopies are in little contact with soil and soil-borne pathogens and maintain dry stems; leaf area index, i.e. the ratio of leaf to surface area, is important for light interception, i.e. canopies with large leaf area indices capture more light for photosynthesis, plant growth and development; leaf wilting is an indication of susceptibility to water deficit stress, i.e., unwilted plants indicate good withstand to soil moisture deficit. These characteristics were identified as good proxies for plant growth, disease resistance, and yield. Their high-throughput assessment can be time- and cost-effective, and accurate when estimated remotely.
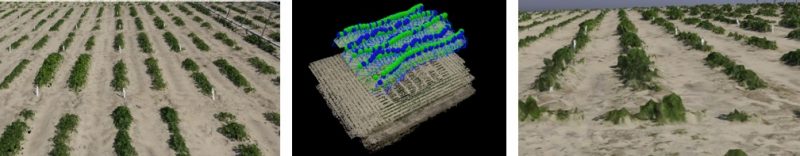
Sayantan Sarkar, a Ph.D. candidate in Dr. Balota’ s lab, develops HTP methods to accurately estimate these characteristics. For example, he used 2 digital terrain models (DTM) in Pix4Dmapper and ArcMap to estimate peanut main stem height from red-green-blue (RGB) images (Fig. 1). He did this using an unmanned aerial vehicle (UAV) and a Sony α6000 camera during two flight missions from the beginning flower to beginning pod peanut growth stages. There was a total of 104 peanut genotypes, planted each in six 10-feet rows, and a total of 1248 data points for model development (Fig. 2). A separate flight mission was used for model validation, which indicated that model’s accuracy ranged from 78 to 91%, depending on the model. The paper was published in the Plant Phenome Journal (TPPJ) here https://acsess.onlinelibrary.wiley.com/doi/full/10.1002/ppj2.20003
and featured on Oct 2020 TPPJ webinar; the video recording is here https://www.youtube.com/channel/UCrZUgobBhF7XpOM99y6fsUw.

Figure 1. Regression of measured vs. RGB-derived plant height with digital terrain model (DTM) 1 (upper left) and DTM 2 (upper right). The difference between these models is the resolution of the bare ground terrain model, which is further subtracted from the DTM including the plants to accurately extract plant height. DTM 1 uses 0.49 cm ground sample distance (lower left) and DTM 2 2.43 cm (lower right); thus DTM 1 uses a much finer bare ground terrain map than DTM 2. The advantage, however, of the DTM 2 is complete software processing vs. manual selection of the bare ground points for DTM 1. This makes the process faster. While DTM 1 is suitable for small plot research, DTM 2 seems more suitable for agronomic applications where big plots and multiple times of data collection are the priority.
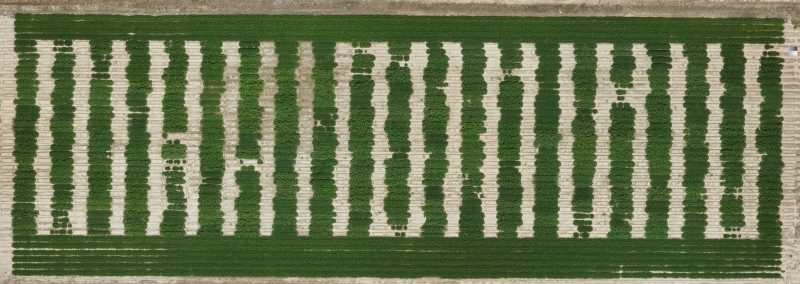
Figure 2. Peanut plots (104 genotypes; 3 replications; 2-row plots) used to estimate plant height from digital images using digital terrain models (DTM).
-
General Item
-
General Item
-
General Item
-
General Item
-
General Item
-
Redirect Item
-
General Item
-
General Item
-
General Item
-
General Item
-
General Item


